Process of walking
- Category: Python Web App
- Type: Student Project
- Course: Python Programming and Data Visuallisation
- Project date: 26 Jannuary, 2022
- Repository URL: GitHub
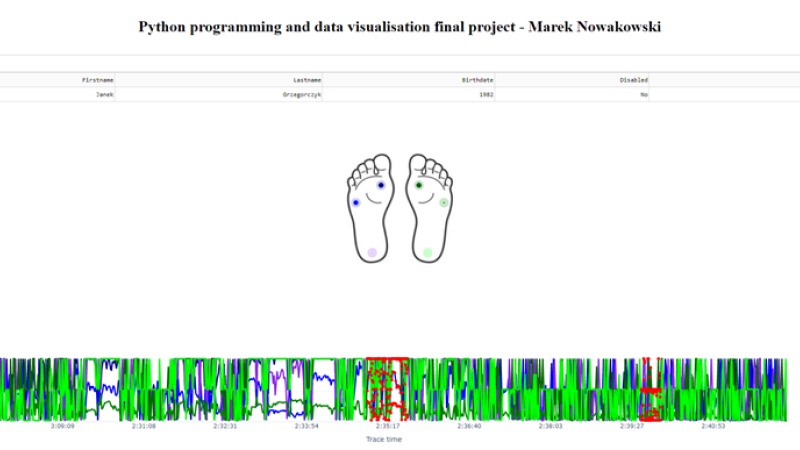
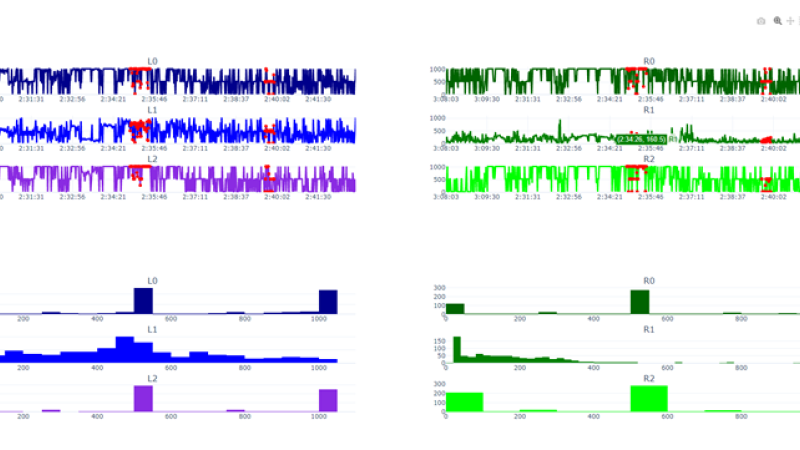
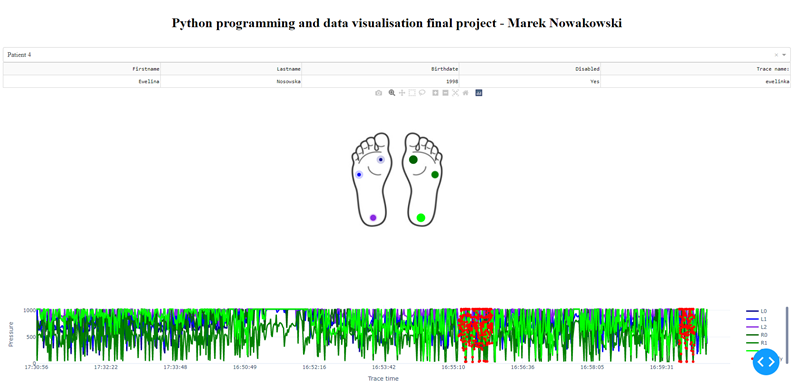
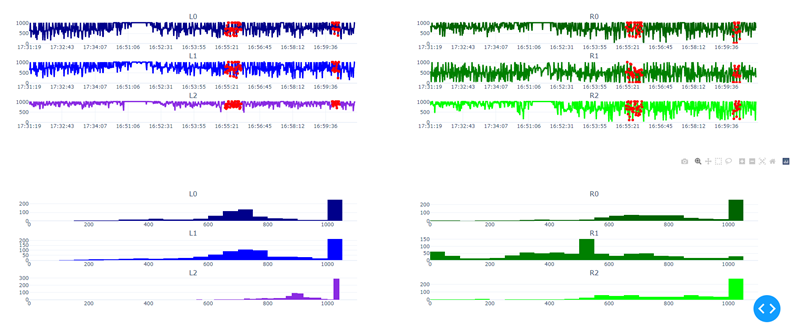
Final project for python programming and data visualization course 2020Z. Web app created in python using the Plotly Dash framework for data visualization. Application presents a graphical visualization of measurements of a device device for monitoring walking habits and patterns of elderly and disabled persons. To be able to use the project you will need a web interface gateway to the simulator of real time measurements. The app is uising HTTP public API for accessing the instantaneous simulated measurements.


